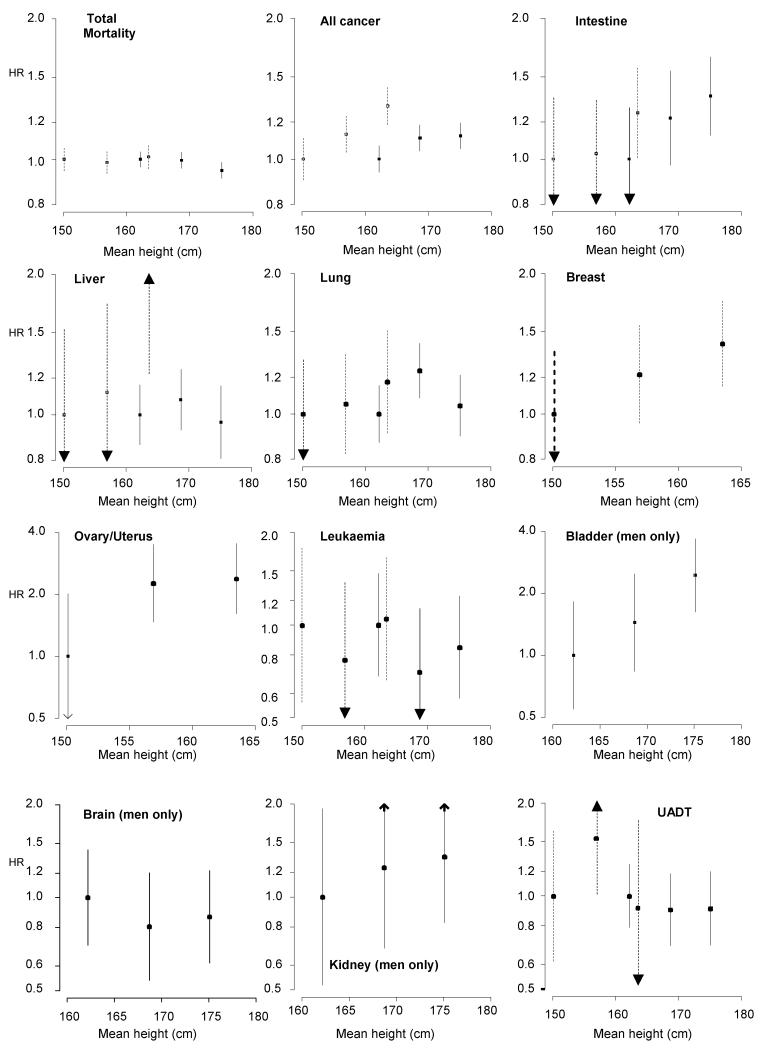
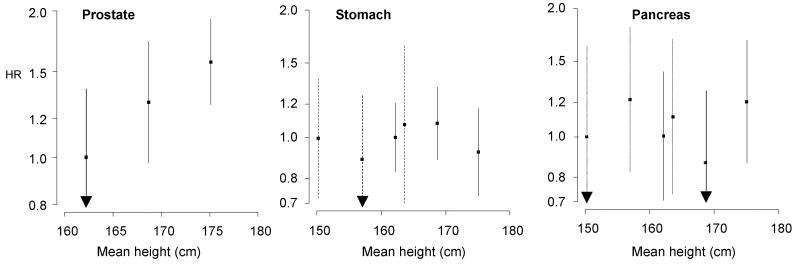
Figure 1. Hazard ratios (95% confidence intervals) for the relation of height tertiles with cancer outcomes.
Dotted lines denote women, solid lines men. Results are missing from these graphs either because there were too few events (breast in men; bladder, brain and kidney in women) or the endpoints were not applicable to men (ovary/uterus) or women (prostate). All hazard ratios are age, study, and year of birth adjusted.


