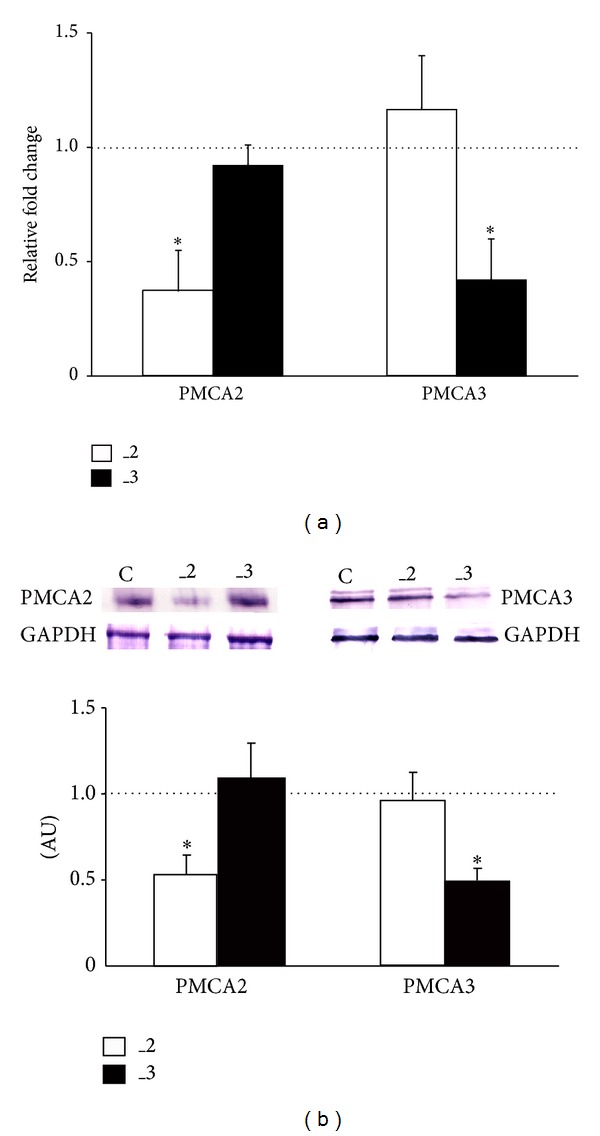
Figure 1.

Efficiency of PMCA isoforms downregulation in differentiated PC12 cells. (a) The relative amount of PMCA2 or PMCA3 transcripts was evaluated by real-time PCR with Gapdh used as a reference gene. The relative fold change was calculated using 2−ΔΔCt method. The level of target gene expression in control line was taken as 1 (dotted line). *P < 0.05, PMCA-deficient lines versus control cells. (b) Western blot analysis of PMCA2 and PMCA3 protein level. The results are shown as arbitrary units (AU) obtained after normalization to endogenous GAPDH content. The level of either PMCA2 or PMCA3 protein in control line was taken as 1 (dotted line). *P < 0.05, PMCA-deficient lines versus control cells. C: mock-transfected PC12, _2: PMCA2-reduced PC12, and _3: PMCA3-reduced PC12.
