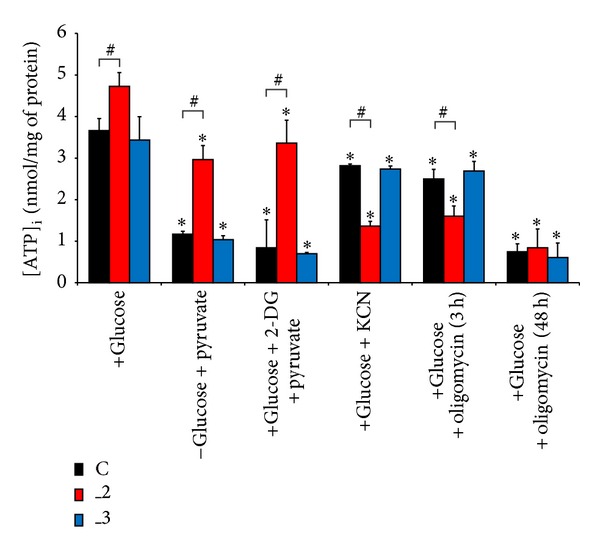
Figure 3.

ATP amount in differentiated PC12 lines after drug treatment. ATP level was quantified luminometrically and calculated using ATP standard and normalized to the protein content in the sample. The results are averages of n = 7 experiments performed in duplicate, using different cell cultures. *P < 0.05 versus control untreated cells, # P < 0.05 treated versus untreated cells. C: mock-transfected PC12, _2: PMCA2-reduced PC12, and _3: PMCA3-reduced PC12.
