Figure 5.
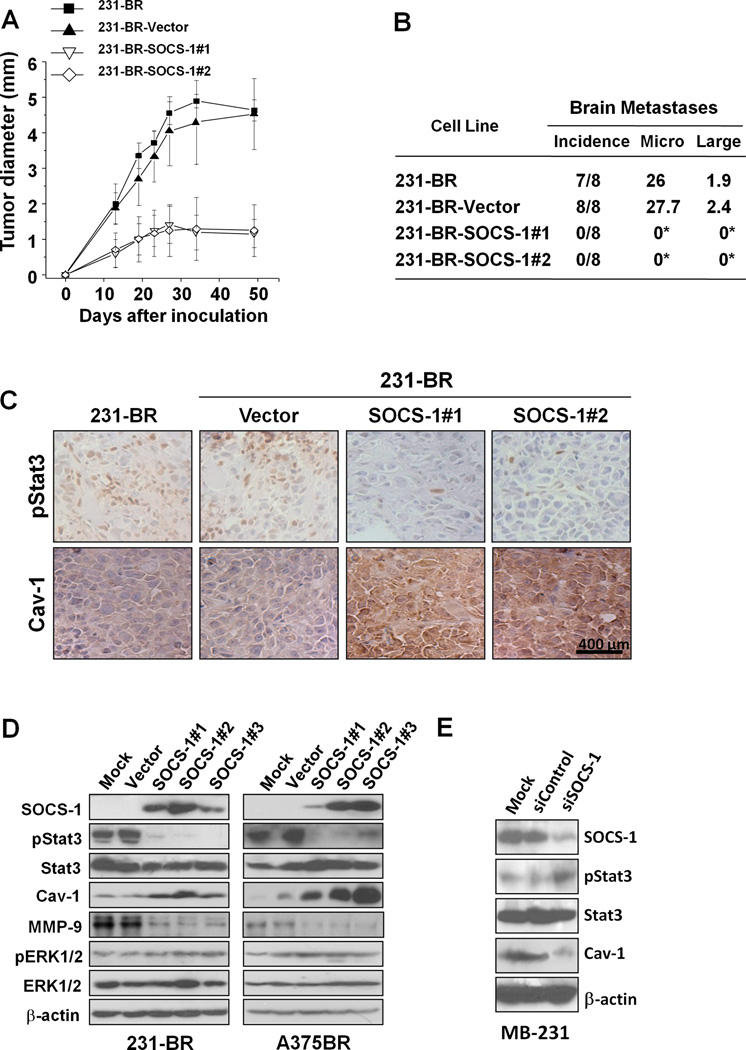
Inhibition of the growth and brain metastases of 231-BR cells by SOCS-1. 231-BR cells were stable transfected with pcDNA3.1 (Vector) or pSOCS-1 plasmids. To avoid clonal selection, we carried out three independent transfections of pSOCS-1 in the cells and pooled hygromycin-resistant colonies to establish stable transfectants, designated as 231-BR-SOCS-1 #1, #2, and #3. A, 231-BR, 231-BR-Vector, and 231-BR-SOCS-1 (SOCS-1 #1 and #2) cells (106/mouse) were injected into the mammary fat pad of nude mice (n=5). The resulting tumors were measured at the indicated time intervals. The data are the mean tumor diameters observed in five mice per group. B, the above tumor cells (3×10⁵/mouse) also were injected into the intracarotid arteries of nude mice. The mice brains were harvested when they were killed, and metastatic tumor formation was assessed histologically (*P<0.01). Incidence indicates the number of mice with brain metastasis divided by the total number of mice injected with tumor cells. Micro, mean number of micro metastases. Large, mean number of large metastases. C, expression of pStat3 and caveolin-1 in tumors from experiments of (A) was analyzed using IHC staining. Representative photos of the IHC staining are shown. D, SOCS-1 upregulated the expression of caveolin-1. 231-BR or A375Br, vector, or SOCS-1 transfected cells were used for analysis of SOCS-1, pStat3, Stat3, caveolin-1, phosphorylated ERK1/2, ERK1/2, MMP-9 and β-actin protein expression by immunoblotting. E, MDA-MB-231 cells transfected with 100 nM siControl or siSOCS-1 were used for analyses of SOCS-1, pStat3, Stat3, caveolin-1, and β-actin protein expression using immunoblotting.

