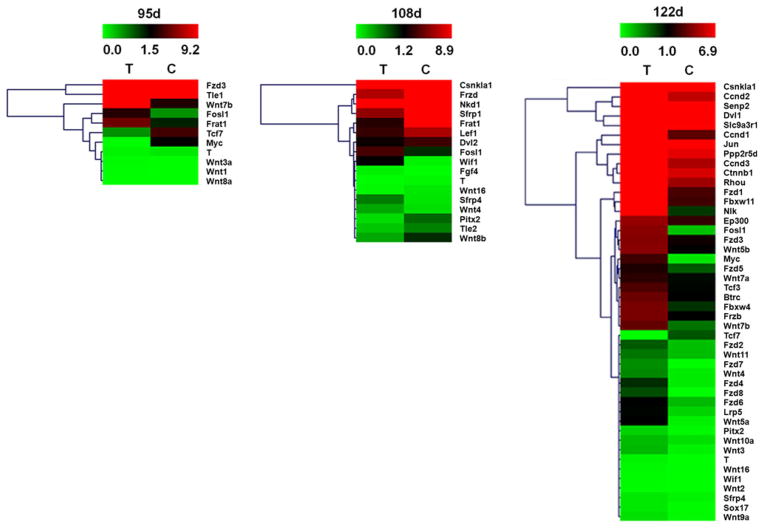
Fig. 1.
Hierarchical clustering of the signal value of differentially expressed genes of Wnt signaling in the spinal cords of ALS mice and wild-type (WT) mice at different stages. The dendrogram was produced by hierarchical clustering of the signal value of differentially expressed genes (rows) in three ALS mice and three WT mice (columns). Green indicated down-regulated genes, black indicated intermediate change, and red indicated up-regulated genes. The hierarchical clustering successfully discriminated the signal value of genes between ALS mice (samples T) and WT mice (samples C) (Color figure online)

