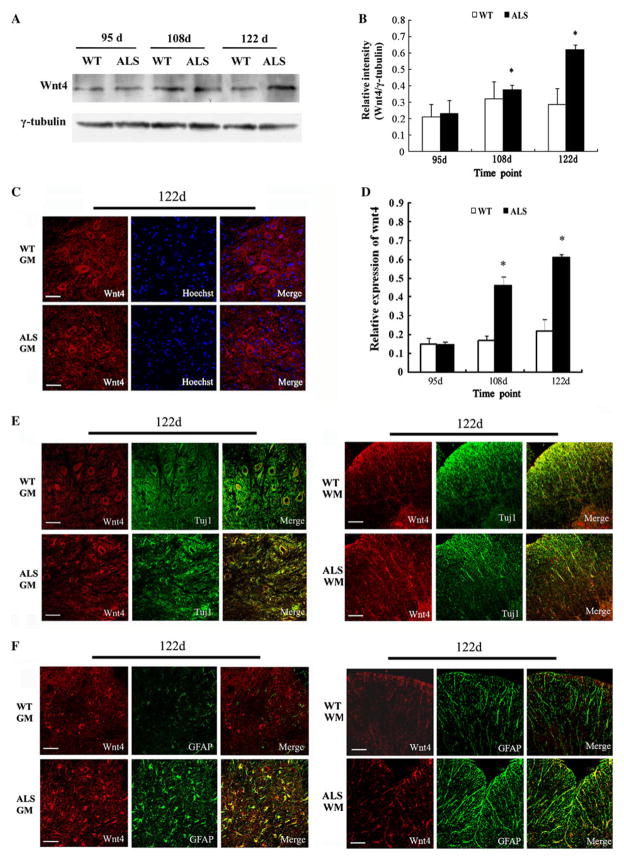
Fig. 3.
Upregulation of Wnt4 in the spinal cords of ALS mice compared with wild-type (WT) mice. a Immunoblotting of Wnt4 level in the spinal cord samples at different stages. γ-tubulin was used as loading control. b The relative level of Wnt4 protein detected by Western blot analysis (n = 5); *p < 0.05 vs. WT littermates. c Staining of spinal cord sections showed the distribution of Wnt4-positive cells in ALS mice and WT mice at 122 days, bar 50 μm. d Quantitative analysis of the number of Wnt4-positive cells in ALS versus wild-type mice at different disease stages (n = 5), *p < 0.05 vs. WT littermates. e Wnt4 (red) and Tuj1 (green) double-positive cells in gray matter (GM) and white matter (WM) at 122 days; bar 50 μm. f Wnt4 (red) and GFAP (green) double-positive cells in gray matter (GM) and white matter (WM) at 122 days; bar 50 μm (Color figure online)

