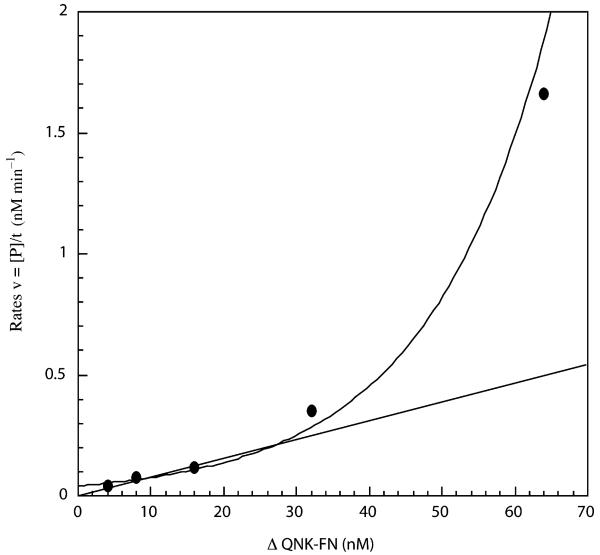
Fig. 1.
Rates of DNA cleavage with various ΔQNK-FN concentrations. A range of ΔQNK-FN concentrations (4, 8, 16, 32, and 64 nM) were used to cleave a fixed concentration of Cfr101-linearized pKT28 (8 nM). The reaction was performed in buffer containing 50 mM NaCl. The rates (v) for the cleavage, determined from the generation of product (P) over time (t), are plotted versus the corresponding ΔQNK-FN concentrations, which indicate the reaction is higher than first order. The line indicates the predicted rates if the reaction was first order with respect to ΔQNK-FN concentrations.

