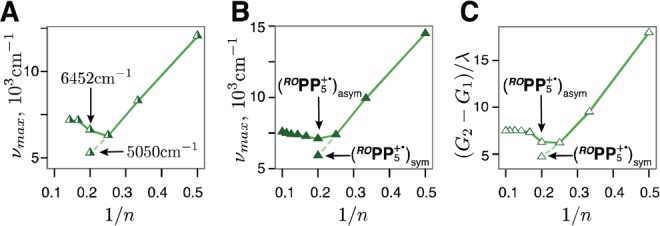
Figure 13.

Experimental excitation energies vs 1/n for ROPPn+• including both ROPP5+• absorption bands 6452 cm–1 and 5050 cm–1 (A), and the corresponding DFT (B) and MPM (C) plots including the excitation energies for (ROPP5+•)asym with the hole asymmetrically displaced towards an end of the chain, and (ROPP5+•)sym with the hole symmetrically distributed in the middle, Figure S36 in Supporting Information. Also see Figures 1B, 3B, and 9B.
