
Figure 6.
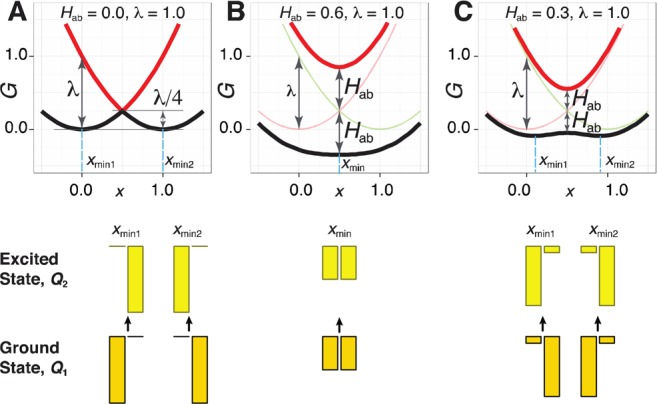
Free energy curves of the diabatic (thin lines) and adiabatic (thick lines) states in the three coupling regimes of the two-parabolic model: weak Hab/λ ≈ 0 (A), strong Hab/λ ≥ 0.5 (B), and intermediate Hab/λ < 0.5 (C). Bar plots represent hole distribution in the ground and vertically excited states at the ground state minimum xmin, calculated as squares of corresponding cij mixing coefficients.