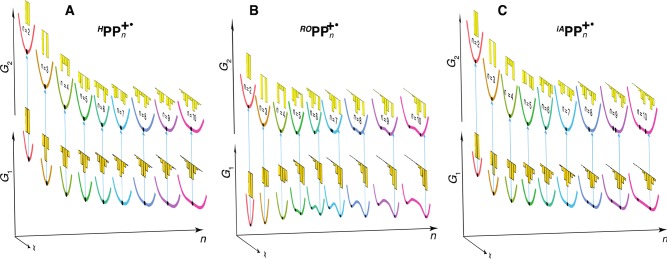
Figure 8.

Multistate parabolic modeling of RPPn+•: pseudo-3D representation of the ground and first excited adiabatic state curves with respect to the effective hole coordinate x for n = 2–10. Minima on the curves are shown as black dots, and the bar charts show the hole distributions in the ground (at a minimum) and vertically excited (at the Franck–Condon point) states. Parameters of MPM: Δε/λ = 0 (HPPn+•), Δε/λ = 8.5 (ROPPn+•), Δε/λ = 3.7 (iAPPn+•); in all cases, Hab/λ = 9. See Figures S26–S28 in the Supporting Information for the corresponding two-dimensional plots.
