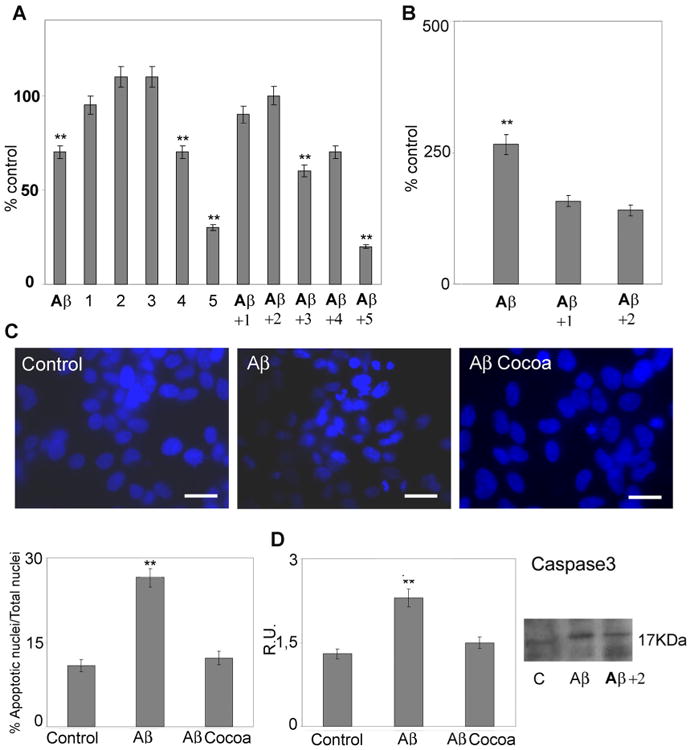
Fig. 1.

Cell viability and death. Right: A: Cell viability was evaluated by MTS assay in control and treated cells. 1:12 μg/ml EC, 4μg/ml CE, 70 μg/ml total polyphenols; 2:30μg/ml of EC, 10 μg/ml CE, 170 μg/ml total polyphenols; 3:60 μg/ml of EC, 20 μg/ml CE, 340 μg/ml of total polyphenols; 4:120 μg/ml EC, 40μg/ml CE,and 700 μg/ml total polyphenols; 5: 240μg/ml EC, 80 μg/ml CEand 1,400μg/ml total polyphenols. B: Apoptosis was evaluated bycytoplasmaticnucleosome concentration. 1:12 μg/ml EC, 4 μg/ml CE, 70μg/ml total polyphenols; 2: 30μg/ml of EC, 10μg/ml CE, 170μg/ml total polyphenols. Data are mean ± SD of three different experiments run in triplicate. **P < 0.005. C: nuclear fragmentation in control and treated cells, evaluated by DAPI nuclear staining, after Aβ treatment administered alone or with coca 2 (30 μg/ml of EC, 10 μg/ml CE, 170 μg/ml total polyphenols). Five fields/coverslips were counted. Data are mean ± SD of three different experiments. **P < 0.005. Bar = 26 μm. D: Western blotting and relative densitometric analysis of active caspase 3. Data are mean ± SD of three different experiments. **P < 0.005. Cocoa extract was used at the final concentrations of 30μg/ml of EC, 10μg/ml CE, 170μg total polyphenols.
