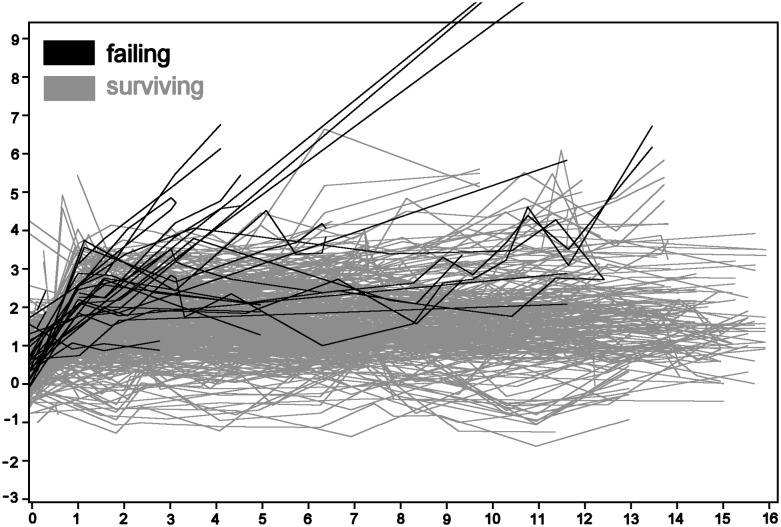
Figure 3.
Follow-up plots of marginal distance (mm) vs years after operation. Both distal and mesial sides are plotted. The plots running out of the scale correspond with two failing implants of the same patient. Negative marginal distances correspond with deeply placed implants (bone touching the implant neck).

