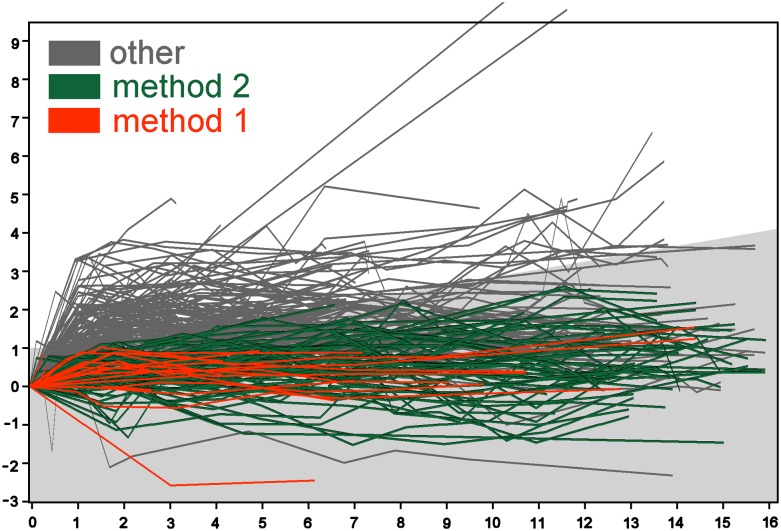
Figure 4.
Changes in marginal distance (mm) vs year after implantation. The first measurement of marginal distance is used as a baseline. Mesial and distal changes are calculated, but only the highest value is plotted. Method 1 pertains to the implants meeting the strictest criteria. Method 2 pertains to the implants meeting the relaxed criteria. The region of bone loss allowed by Methods 2 and 3 is shaded grey.

