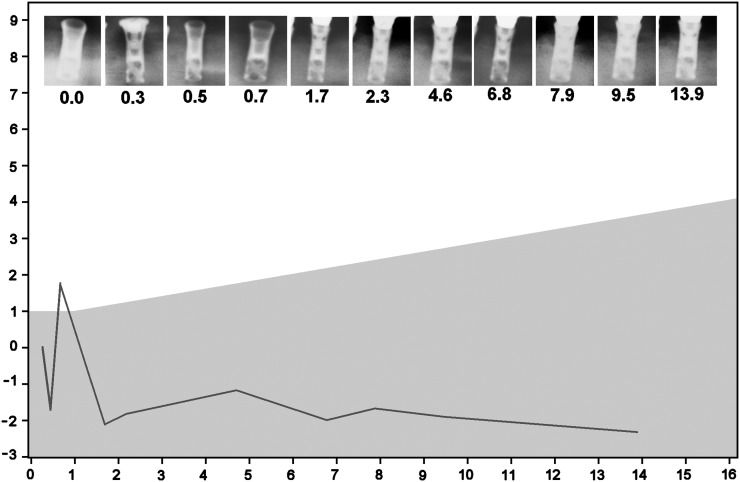
Figure 5.
Changes in marginal distance (mm) vs year after implantation. Example of a successful implant according to Methods 3 and 4 but not according to Methods 1 and 2. Owing to one single radiograph, made 0.7 years after implantation, the marginal distance rises 3.5 mm and then falls 3.9 mm during the next year. The region of bone loss allowed by Methods 2 and 3 is shaded grey.

