
Figure 2.
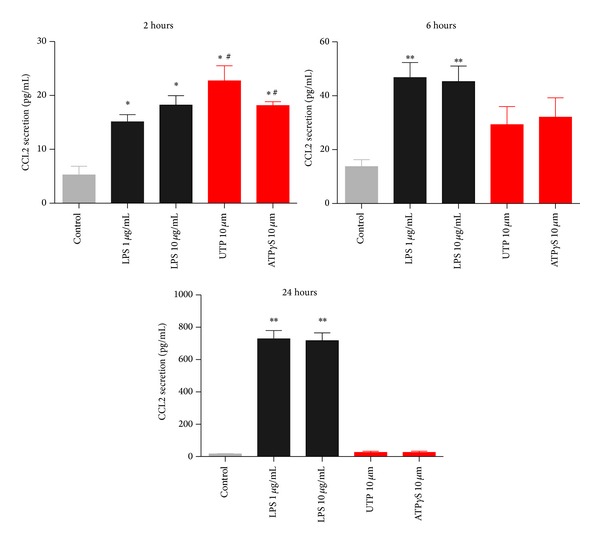
The effect of P2Y2 agonists compared with LPS on CCL2 secretion from unprimed THP-1 cells. THP-1 cells were plated in RPMI media containing 1% serum and stimulated with media alone, LPS (1 or 10 μg/mL), UTP (10 μM), or ATPγS (10 μM) for the times indicated above each graph. Mean raw data is plotted in pg/mL ± SEM from three independent experiments. Symbols: ∗ denotes P < 0.05 compared with control, # denotes no significant difference between treatments, and ns denotes not significant with respect to control (one-way ANOVA with Tukey's post hoc test). Standard curves were performed for each ELISA experiment with fits of r > 0.95.