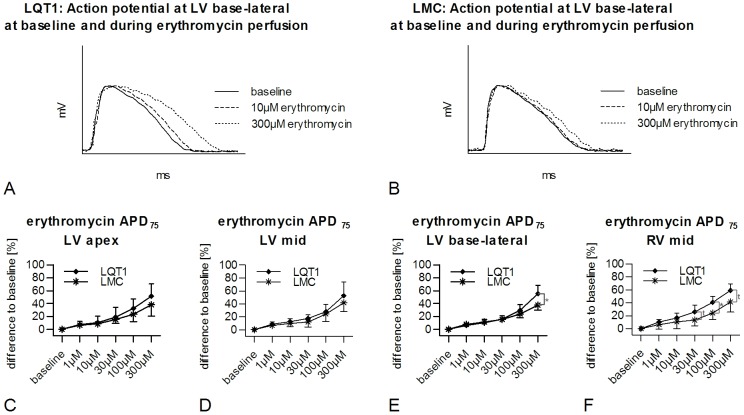
Figure 2. Erythromycin-induced prolongation of APD and in LQT1 and LMC rabbits.
Exemplary, representative MAP in (A) LQT1 and (B) LMC rabbit at baseline and at different concentrations of erythromycin. Percentaged prolongation of APD related to baseline APD (%APD) in LQT1 (n = 9) and LMC (n = 7) rabbits in (C) LV apex, (D) LV mid, (E) LV base-lateral and (F) RV mid positions during perfusion with increasing concentrations of erythromycin. t = trend (p<0.1), *p<0.05.

