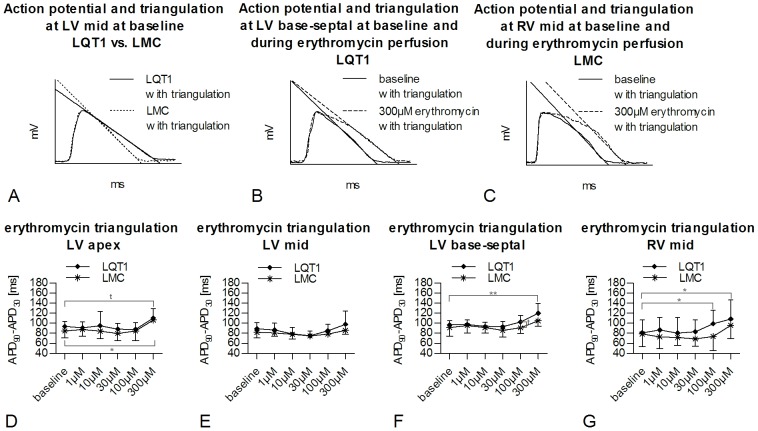
Figure 5. Erythromycin-induced changes in triangulation of monophasic action potential in LQT1 and LMC rabbits.
Exemplary, representative MAP triangulation in (A) LQT1 and LMC rabbit at baseline. Exemplary, representative MAP triangulation in (B) LQT1 rabbit and (C) LMC rabbit at baseline and during 300 µM erythromycin. Triangulation of MAP at increasing concentrations of erythromycin in LQT1 (n = 9) and LMC (n = 7) rabbits in (D) LV apex, (E) LV mid, (F) LV base septal, and (G) RV mid position. t = trend (p<0.1), *p<0.05, **p<0.01.

