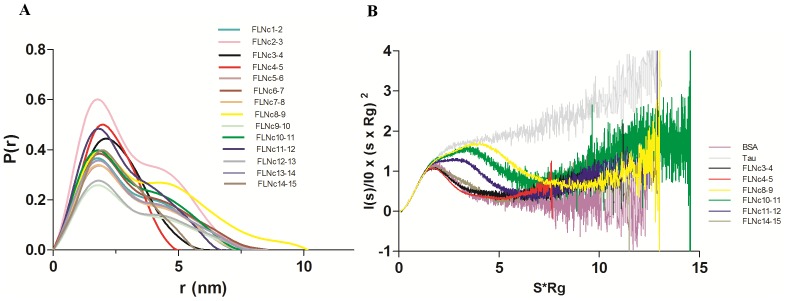
Figure 2. Distance distribution profile and dimensionless Kratky plots.
(A) P(r) vs r plot of all the constructs. This is supported by Supporting Information S4 in File S1. (B) Dimensionless Kratky plots of the four compact, average extended and most extended fragments compared to BSA (folded protein) and Tau (unfolded protein).

