Figure 2.
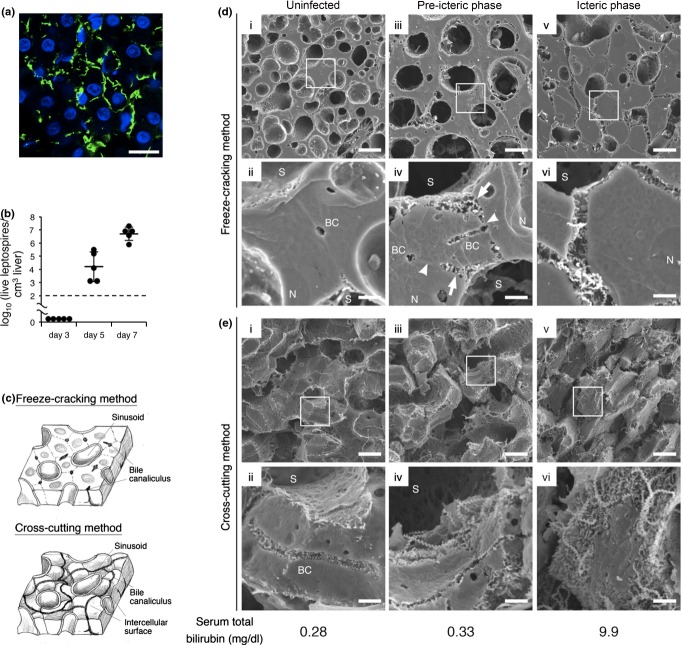
Disruption of intercellular adhesion caused by leptospires in the liver triggers jaundice. (a) Representative confocal images of liver from hamsters infected with Leptospira interrogans strain K37 at eighth day postinoculation showing leptospires stained with rabbit polyclonal antisera and Alexa Fluor 488 conjugated anti-rabbit monoclonal antibody (green), and nuclei of liver cells stained with DAPI (blue) Scale bar, 10 μm. (b) Numbers of culturable leptospires in 1 cm3 of hamster livers at third, fifth and seventh day postinoculation determined by dilution method. Black dashed line represents the limit of detection. Data are the mean ± SD. (c) Schematic diagram of the liver structure exposed by two methods of sample preparation. Freeze-cracking method exposes flat fractured surface (top image). Cross-cutting method exposes intercellular surface (bottom image). (d,e) Representative scanning electron microscope images of the livers from uninfected hamsters (i and ii) or infected hamsters in pre-icteric (iii and iv) or icteric phase (v and vi) using freeze-cracking (d) and cross-cutting methods (e). The framed areas in the top images are enlarged in the bottom images. The scale bars represent 10 μm for the top images and 2 μm for the bottom images. The arrows show hepatocyte membrane detached from the adjacent cell. The arrowheads point to hepatocyte membranes that remained attached to the adjoining cell. Total bilirubin concentration of each hamster is indicated below the images. BC, bile canaliculi; N, nucleus of the hepatocyte; and S, sinusoid.

