Figure 4.

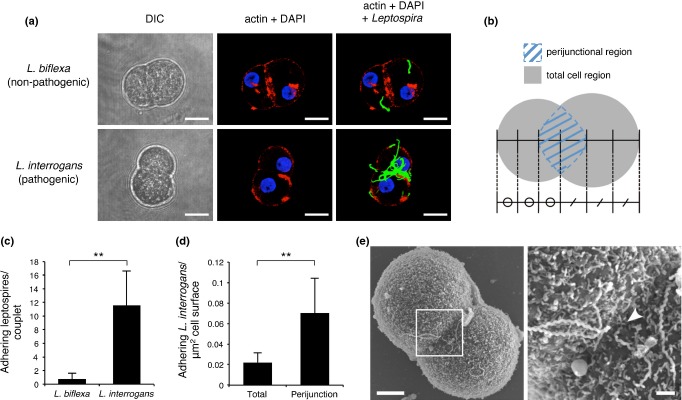
Attachment and invasion to host hepatocytes are characteristic of pathogenic leptospires. (a) Representative confocal images of isolated hamster hepatocyte couplets infected with pathogenic (Leptospira interrogans) or non-pathogenic (Leptospira biflexa) leptospires on coverslips for 1 h showing actin accumulation stained with Acti-stain 555 phalloidin (red), and leptospires stained with rabbit polyclonal antisera and Alexa Fluor 488 conjugated anti-rabbit monoclonal antibody (green). Nuclei of liver cells were stained with DAPI (blue). Non-adherent bacteria were washed out. Projections of three-dimensional reconstructions are shown Scale bar, 10 μm. (b) Schematic diagram of hepatocyte couplet indicating the total cell (grey) and perijunctional (blue striped) regions. The perijunctional region was defined as an ellipse with its long axis overlying the junction of the two hepatocytes, and its transverse axis extending over one-third of the transverse diameter of each cell. The total cell region included the perijunctional region. (c,d) Analysis of the number of pathogenic or non-pathogenic leptospires adhering to the total cell region of a couplet (c) and the number of adhering pathogenic leptospires per μm2 of total cell or perijunctional regions (d). n = 50 per group. Data are shown as the mean ± SD. Statistical significance is shown by **P < 0.001 as determined by Welch's t-test. (e) Representative scanning electron microscope images of isolated hamster hepatocyte couplet infected by L. interrogans strain K37. The framed area in the left image is enlarged in the right image. The scale bar represents 5 μm for the left image and 1 μm for the right image. The white arrowhead shows one end of a spirochete entering the intercellular junction (right).
