
Figure 5. Comparison of ovarian HGSC and CCC.
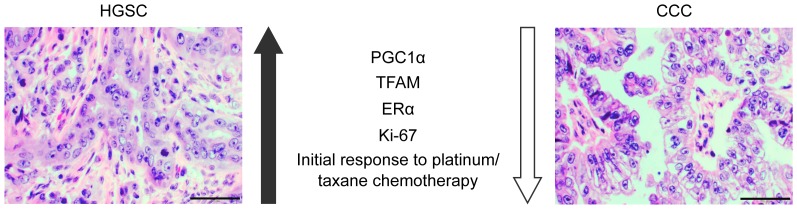
Representative hematoxylin and eosin staining of ovarian HGSC and CCC. We hypothesise that these subtypes represents extreme forms of EOC; HGSC generally display positive expression of PGC1α, TFAM and ERα, have a higher Ki-67 index and are more responsive to initial platinum/taxane chemotherapy. By contrast, CCC generally do not express PGC1α, TFAM and ERα, have a lower Ki-67 index and are less responsive to initial platinum/taxane chemotherapy. Magnification 400x, scale bar shows 50 µm.