
Figure 3. HPLC analysis of end products of ChiA2-treated mucin.
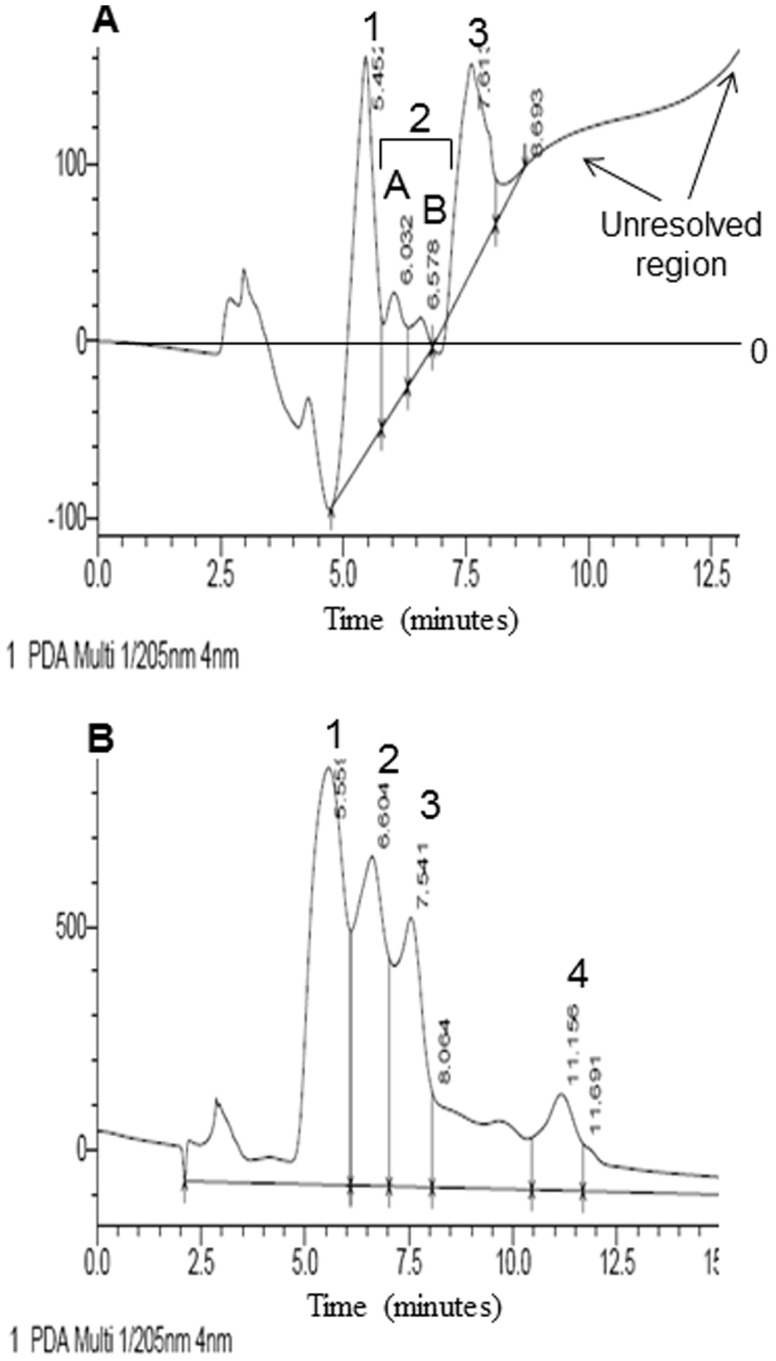
The mucin-ChiA2 Reactions were carried as mentioned in the materials and methods section. The end products were analyzed using a 4.6 nm×250, 5 µm Zorbax carbohydrate analysis column (Agilent Technologies, Waldbrown, Germany) connected to a Shimadzu Prominence 20A; HPLC system. A. This figure shows the HPLC chromatogram of the end products of ChiA2 treated mucin. The chromatogram shows four distinct peaks and an unresolved region. Peak 1 with retention time 5.4 minutes indicates presence of GlcNAc. Peak 2 indicates presence of (GlcNAc)2 which is divided into two separate peaks: peak 2A and peak 2B. Peak 2A with retention time 6.0 minutes probably is for the β enantiomer and peak 2B with retention time 6.57 minutes is for α enantiomer of (GlcNAc)2. Peak 3 with retention time 7.6 minutes indicates the presence of (GlcNAc)3. B. This is the HPLC chromatogram of standards of GlcNAc, (GlcNAc)2, (GlcNAc)3 and (GlcNAc)6. The chromatogram shows 4 distinct peaks. Peak 1 with retention time 5.5 minutes is for GlcNAc. Peak 2 with retention time 6.6 minutes is for α-(GlcNAc)2. Peak 3 with retention time 7.5 minutes is for (GlcNAc)3 and peak 4 with retention time 11.1 minutes is for (GlcNAc)6.