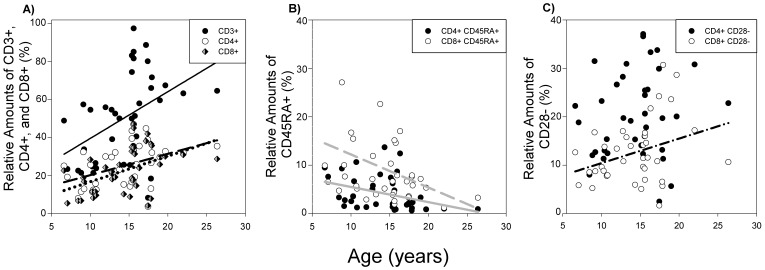
Figure 1. The impact of age on relative amounts of T cell subsets (n = 38).
A) The effect of age on relative T cell populations. A) Relative number of CD3+, CD4+, and CD8+ increased with age (P<0.05). B) Relative number of naïve lymphocytes, CD4+ CD45RA+ and CD8+ CD45RA+, were negatively correlated with age (P<0.01). C) While age was positively correlated with the relative number of CD8+ CD28- lymphocytes (P<0.05), age did not impact relative amounts of CD4+ CD28- cells (P = 0.36). The black line represents the results of linear regression analysis for CD3+, the black dashed line for CD4+, the black dotted line for CD8+, the grey line for CD4+ CD45RA+, the grey dashed line for CD8+ CD45RA+, and the black dash-dotted line for CD8+ CD28- lymphocyte subtypes.

