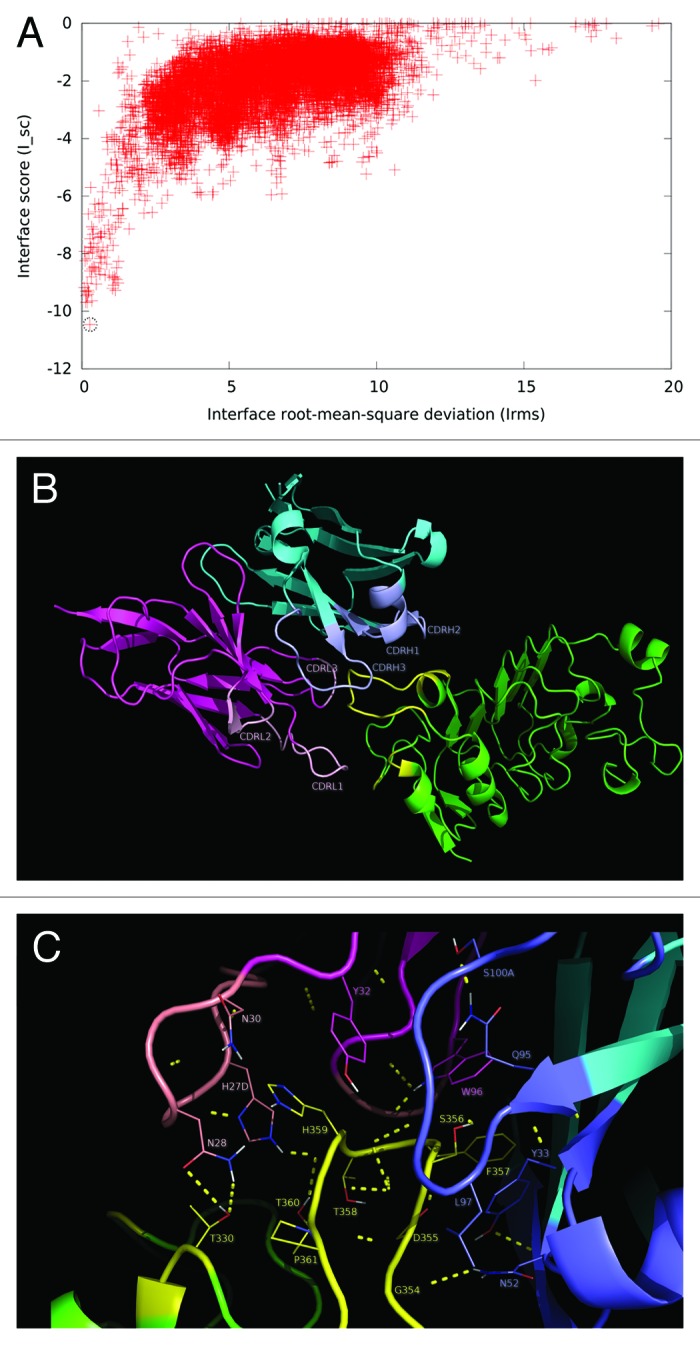
Figure 6. Structural model of nimotuzumab/EGFR complex. (A) Energy landscape of the perturbation analysis from which the best docking model (solution indicated by the dotted line circle) was obtained. (B) Cartoon representation of the structure of the nimotuzumab/EGFR complex according to the selected model. Nimotuzumab heavy and light chains, and erEGFR are colored cyan, magenta and green, respectively. The structural epitope is in yellow while complementarity determining regions from heavy and light chains are represented in blue and red respectively. (C) Interaction interface. Side chains of residues in the interface are shown as lines and hydrogen bonds are shown as discontinuous yellow lines. Residues and chains are colored as in (B).
