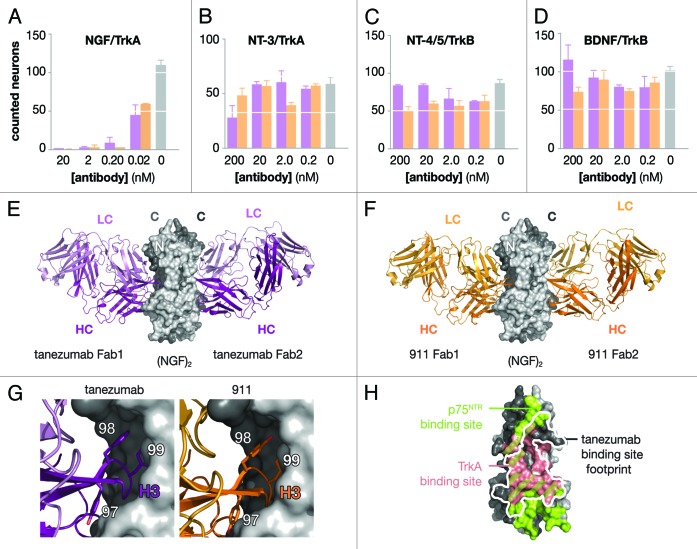
Figure 2. Functional and structural analysis of tanezumab and 911. Neuron survival assays (A–D) for decreasing concentrations of full-length antibody either tanezuamb (purple) or 911 (orange). The control (gray) represents neurotrophin without antibody added to the well. TG neurons express TrkA and survive in the presence of NGF (A) or NT-3 (B). Nodose neurons express TrkB and survive in the presence of NT-4/5 (c) or BDNF (d). X-ray crystal structures determined for two tanezuamb Fab (purple) bound to (NGF)2 (E) and two 911 Fab (orange) bound to (NGF)2 (F). Side-by-side comparison (G) tanezumab and 911 H3 residues 97–99. (H) Tanezumab-NGF binding site (white) overlaid “footprint” on the p75NTR (green) and TrkA (pink) binding sites on one side of (NGF)2.

An official website of the United States government
Here's how you know
Official websites use .gov
A
.gov website belongs to an official
government organization in the United States.
Secure .gov websites use HTTPS
A lock (
) or https:// means you've safely
connected to the .gov website. Share sensitive
information only on official, secure websites.
