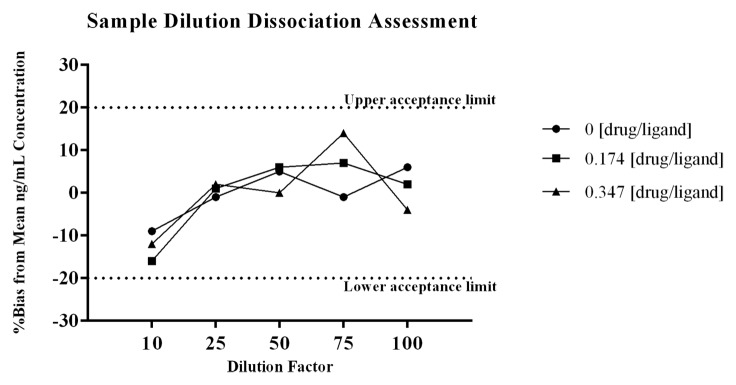
Figure 4. To assess the effect that sample dilution may have on the binding equilibrium, samples containing drug and ligand were diluted through the linear range of the method. The samples were diluted by factors of 10, 25, 50, 75, and 100 prior to addition to the plate. The samples tested were prepared with drug:ligand molar ratios of 0, 0.174, and 0.347. To normalize for matrix effects at the various dilutions each diluted test sample was quantitated against a dilution matched standard curve. As shown in Figure 4 there is a decrease in the level of PCSK9 measured at a 1:10 dilution, and this appears to be due to a matrix effect as the observation is consistent within the control sample with no drug. The difference in quantified levels of PCSK9 between the 1:10 and the 1:100 dilutions were all ≤ 18% for all samples. For each test dilution the %bias from the mean ng/mL concentration of the sample dilution series showed all values were within ± 20%. The data demonstrates that sample dilution does not significantly liberate PCSK9 from the complex.
