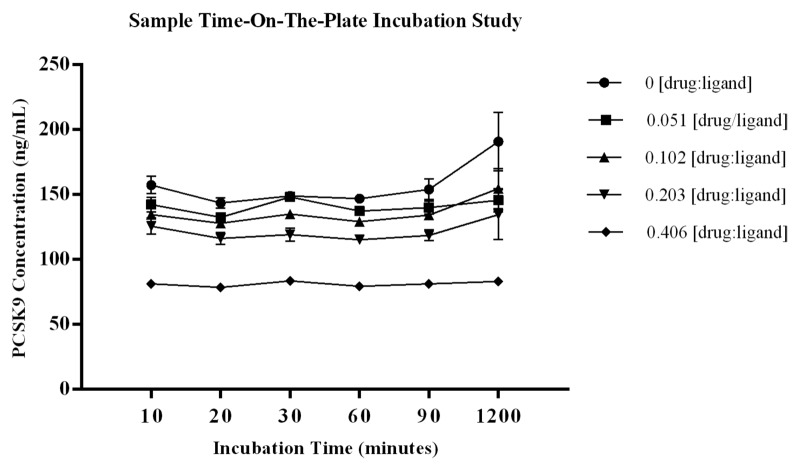
Figure 5. Graphical summary of the data from the study to evaluate the effect that sample incubation time on-the-plate may have on the equilibrium of free vs. bound ligand. Diluted samples were incubated on the plate for 10, 30, 60, 90, and 1200 min at room temperature. The %bias from the mean ng/mL PCSK9 for each test sample showed the largest %bias to be 21.7%, and this occurred at the 1200 min time point within the control sample with no drug added. The remainder of the test samples had %biases from the mean PCSK9 concentration of each test series that were within ± 9% (CV for calculated means ≤ 11.1%). The CV of the three independent aliquots analyzed for each test sample was ≤ 14.2% demonstrating robustness of the data sets. Data are presented graphically in Figure 5 with STD error bars from n = 3 independent measurements at each point.

An official website of the United States government
Here's how you know
Official websites use .gov
A
.gov website belongs to an official
government organization in the United States.
Secure .gov websites use HTTPS
A lock (
) or https:// means you've safely
connected to the .gov website. Share sensitive
information only on official, secure websites.
