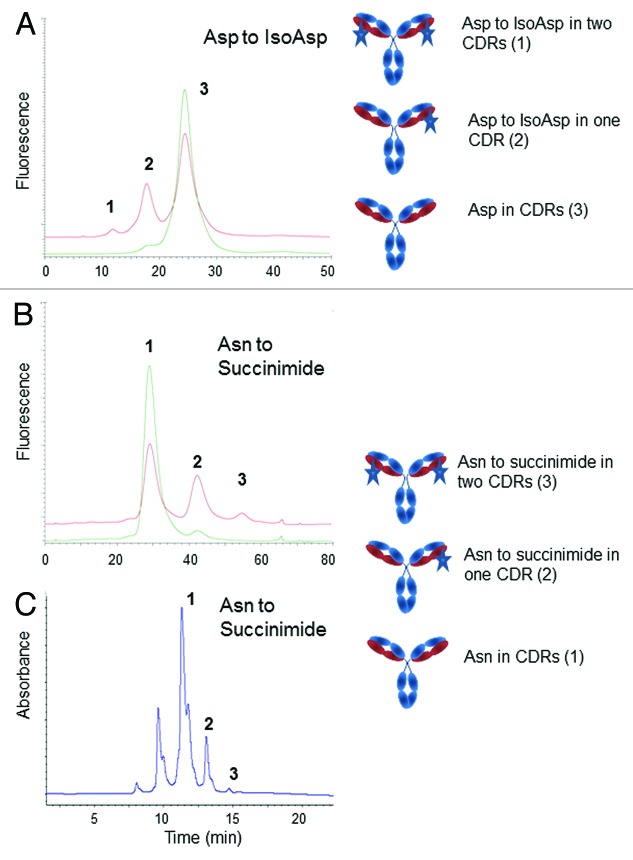
Figure 3. Elution profile on two Dionex Propac HIC-10 columns in series of a mAb presenting an isoAsp residue (A) or succinimide (B) in one and both of a light chain CDR (indicated as stars in the cartoon). Panels A and B, show an overlay of mAbs controls and stressed at 40 °C. Elution profile on TSKgel butyl-NPR of a mAb presenting a succinimide (C) in the Fab region of a mAb. Species eluting under each peak (numbered 1, 2, and 3) are shown in cartoons. Chromatograms reproduced with permission from Elsevier and David Ouellette (Refs. 6 and 11, respectively).

An official website of the United States government
Here's how you know
Official websites use .gov
A
.gov website belongs to an official
government organization in the United States.
Secure .gov websites use HTTPS
A lock (
) or https:// means you've safely
connected to the .gov website. Share sensitive
information only on official, secure websites.
