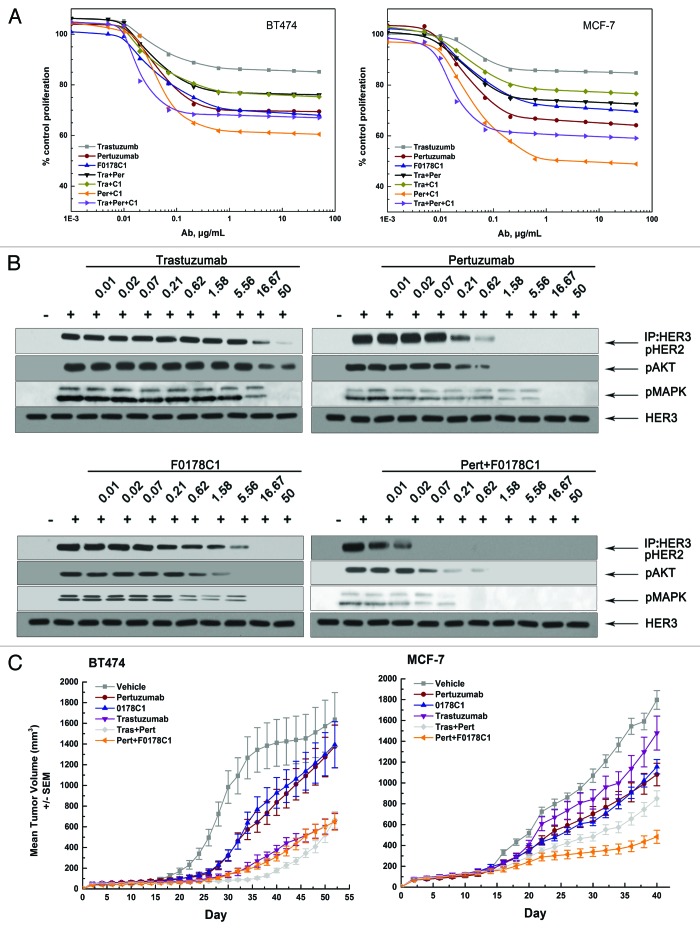
Figure 4. F0178-C1 effectively Inhibits HER2/HER3-Dependent Signaling and Tumor Growth in Xenograft Models and Shows Increased Inhibition When Combined with Pertuzumab. (A) BT474 and MCF-7 cells were treated with increasing concentration of trastuzumab (gray line), pertuzumab (wine line), F0178-C1 (blue line), the combination of trastuzumab plus pertuzumab (black line), the combination of trastuzumab plus F0178-C1 (dark yellow line), the combination of pertuzumab plus F0178-C1 (orange line), or the combination of trastuzumab plus pertuzumab plus F0178-C1 (violet line) in the presence of HRG (2 nM). Concentrations shown on the x axis reflect the concentration of the single antibody. Cell proliferation relative to untreated control was measured after 4 d using AlamarBlue staining. (B) MCF-7 cells treated with indicated concentrations of trastuzumab, pertuzumab, F0178-C1 or combination of pertuzumab and F0178-C1 were stimulated with 0.5 nM HRG for 10 min. Co-immunoprecipitation assay with an anti-HER3 antibody and blotted for pHER2, and Cell lysates were and immunoblotted to detect pAKT (Ser473), pERK1/2 (Thr202/Tyr204), and total HER3. (C) Mice with established BT474 and MCF-7 cells xenografts were injected intraperitoneally with single dose of pertuzumab (12.5 mg/kg, wine line), trastuzumab (12.5 mg/kg, violet line), F0178-C1 (12.5 mg/kg, blue line), combination of trastuzumab plus pertuzumab (12.5 mg/kg, light gray line)combination of pertuzumab plus F0178-C1 (12.5 mg/kg, orange line), or vehicle (gray line). Data are presented as mean tumor volume ± SEM.

An official website of the United States government
Here's how you know
Official websites use .gov
A
.gov website belongs to an official
government organization in the United States.
Secure .gov websites use HTTPS
A lock (
) or https:// means you've safely
connected to the .gov website. Share sensitive
information only on official, secure websites.
