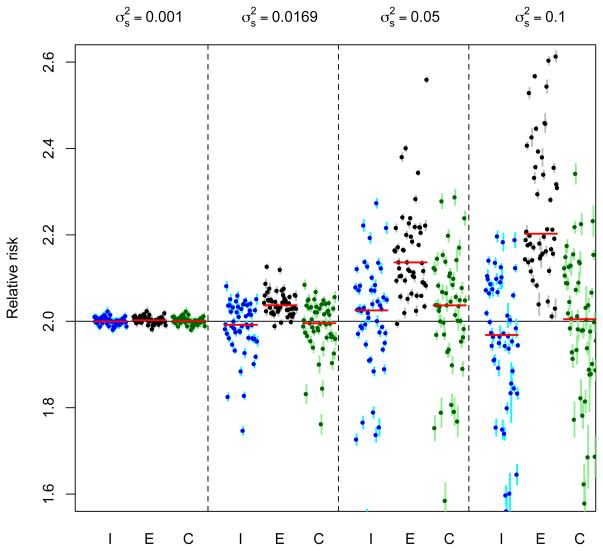
Figure 2.
Results from fitting three models; I: Individual, E: Ecological and C: Convolution to fifty sets of simulated data for two years of daily data using varying degrees of spatial variation. In this case, the exposures are predictions from a spatial model. Dots show the estimated relative risk from each of the simulations with vertical lines indicating the width of the corresponding 95% confidence intervals. Horizontal red lines indicate the median relative risk from each of the fifty simulation with the horizontal black line showing the ‘true’ relative risk of two.

