
Figure 5.
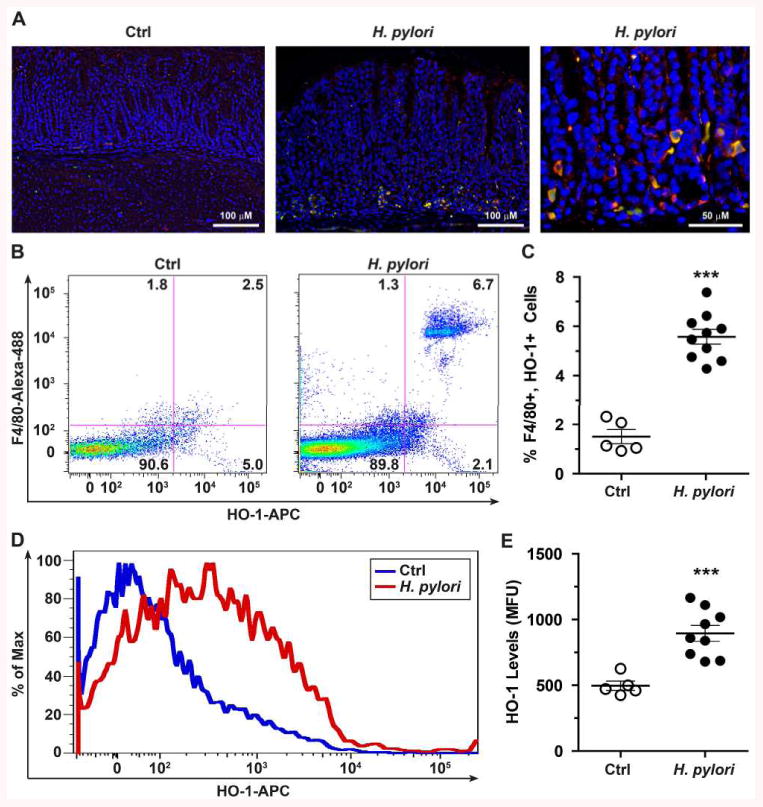
Expression of HO-1 in gastric macrophages during H. pylori infection. A, Immunofluorescence performed in the gastric tissue of C57BL/6 mice infected or not with H. pylori PMSS1 for 2 months. The macrophage marker F4/80, HO-1, and nuclei were detected with TRITC (red), DyLight 488 (green), and DAPI (blue), respectively; merged images are shown, with cells double-positive for F4/80 and HO-1 depicted by yellow color. B-E, Gastric cells were isolated from mice and analyzed by flow cytometry for the expression of F4/80 and HO-1. Representative dot plots with percent of cells in each quadrant (B) and flow cytometric analysis of HO-1 levels in mean fluorescence units (D). The summary data are presented in (C) and (E). ***P < 0.001 vs Ctrl; each symbol represents a different mouse.