
Fig. 2.
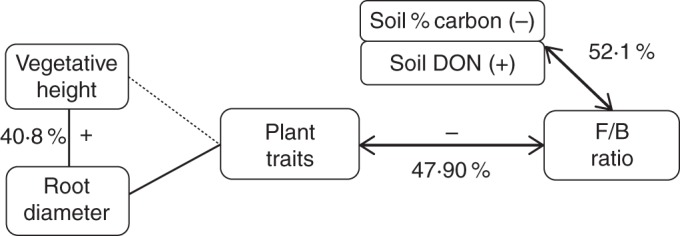
Schematic diagram showing potential links and percentages of explanation of soil properties and plant traits on the F/B ratio (fungal to bacterial PLFA ratio). Positive and negative correlations are represented by + and – symbols next to the arrows when only one variable was involved in the relationship, and by (+) and (–) next to each variable when two variables were involved in the relationships.