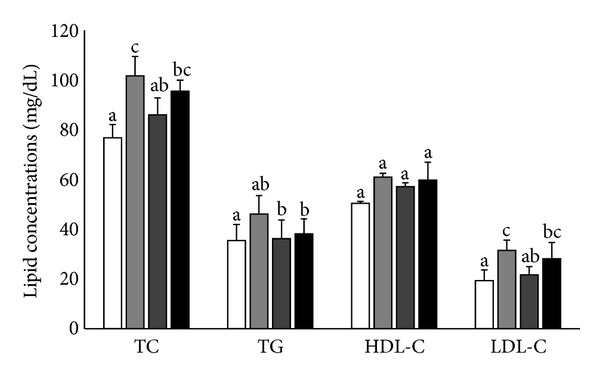
Figure 2.

Effects of ASA (30 mg/kg/day) and DJS (100 mg/kg/day) on serum lipid profiles in SD rats compared with their corresponding controls: serum total cholesterol (TC), triglyceride (TG), high-density lipoprotein cholesterol (HDL-C), low-density lipoprotein cholesterol (LDL-C) levels in Sham (white bar) and OVX SD rats after 5 weeks of oral demonstration with saline (grey bar), ASA (dark grey bar, 30 mg/kg/day), or DJS (black bar, 100 mg/kg/day). Values of the same measured parameter that are not followed by the same alphabetical letter are significantly different (n = 5–7 in each group).
