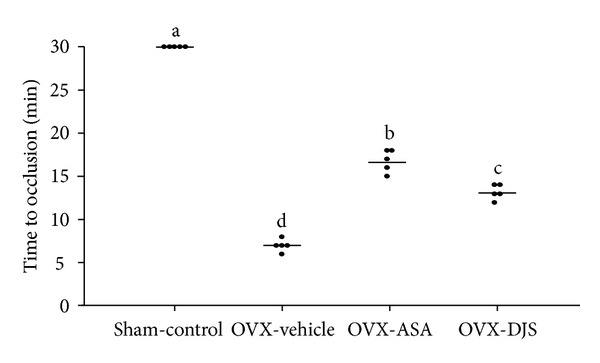
Figure 4.

Time to occlusion of DJS in a carotid arterial thrombosis model. The horizontal lines represent the mean of the displayed values for time to occlusion in each group. Values of the same measured parameter that are not followed by the same alphabetical letter are significantly different (n = 5 in each group).
