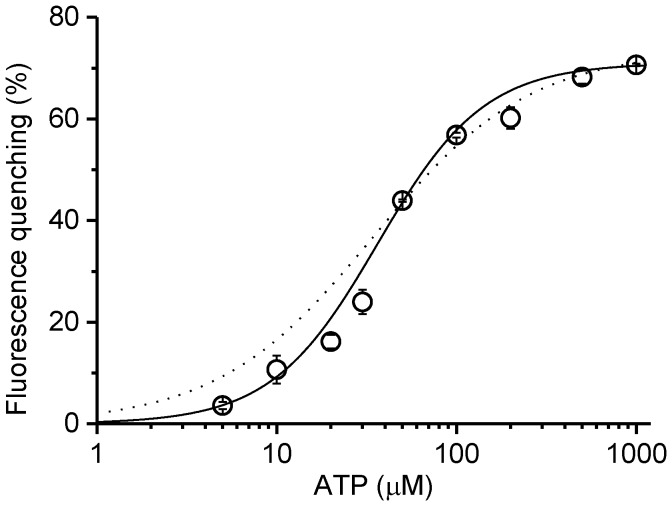
Figure 3. Titration of fluorescence by ATP.
Changes in the fluorescence upon addition of ATP are expressed as percent of the fluorescence before the addition of ATP. Values are taken when the fluorescence reached a plateau. Error bars represent standard errors. The solid line represents the theoretical curve with the Hill equation (Fluorescence quenching = ΔFL max×[ATP]n/(Kd n+[ATP]n)) with the following parameters(± standard error); Kd = 36.5±1.2 µM, ΔFL max = 71.0±0.7%, n = 1.47±0.1. The dotted line represents the theoretical curve with simple binding equation (Fluorescence quenching = ΔFL max×[ATP]/(Kd+[ATP])) with K d = 34.4±2.9 µM, ΔFL max = 73.5±1.5%.

