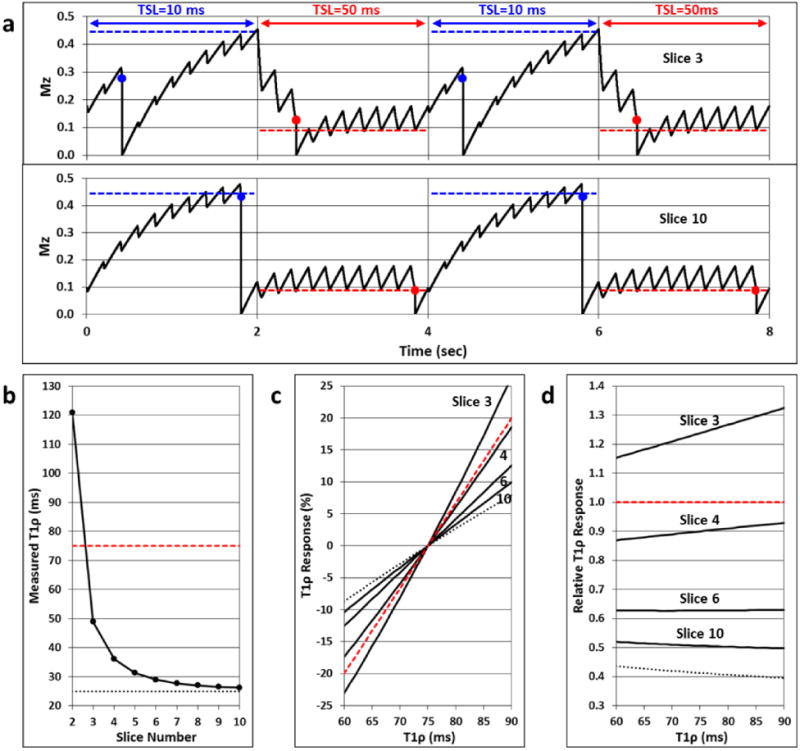
Fig. 3.

Simulation of T1ρ fidelity for an N=10, τ=200 ms functional T1ρ mapping sequence assuming T1ρ=75 ms and T1=1500 ms. (a) Longitudinal magnetization signal evolution Mz(t) for Slices 3 and 10. The TSL is switched between 10 and 50 ms every TR interval (2.0 sec). The slice-specific measurable TSL signals are indicated by the blue and red dots. For each TSL, Mz(t) approaches a steady-state signal (blue and red dashed lines). The TSL steady-state signals are not reached for Slice 3, but they are nearly reached for Slice 10. (b) Measured T1ρ relaxation time for each of the 10 slices using Eq. (1) and the TSL signals. The true (red dashed line) and sequence steady-state (dotted line) T1ρ values are also shown for comparison. Slices 1 and 2 deviate greatly from the T1ρ steady-state value, but Slices 3 through 10 quickly approach it. (c) Slice-specific T1ρ responses to a dynamic change in the true T1ρ value (±20%). Plots are shown for Slices 3, 4, 6, and 10, and the true (red dashed line) and steady-state (dotted line) responses are indicated. For Slice 10, the response is underestimated by a factor of two. This is shown in (d), which plots the ratio of the slice-specific T1ρ responses to the true response. For a given slice, the relative response is fairly consistent across the range of T1ρ dynamics.
