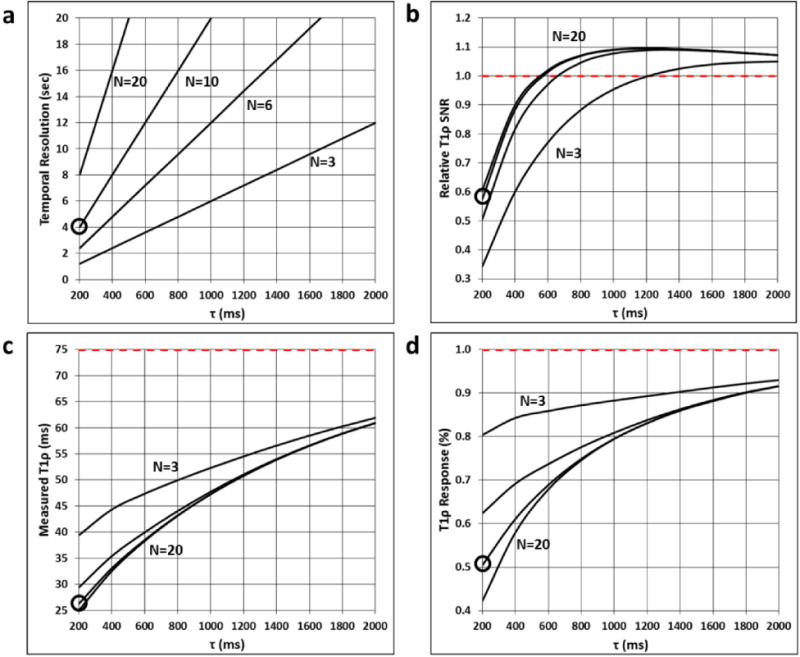
Fig. 5.

Functional T1ρ mapping sequence tradeoffs for different numbers of slices N and slice acquisition times τ. (a) Temporal resolution, (b) T1ρ SNR relative to a sequence with τ≫≫T1, (c) measured T1ρ relaxation time, and (d) functional T1ρ response to a 1% change in the true T1ρ value of 75 ms are plotted vs. τ for the final slice of N=3, 6, 10, and 20 sequences. Ideal values are shown as red dashed lines. The results for the N=10, τ=200 ms sequence investigated in this work are circled.
