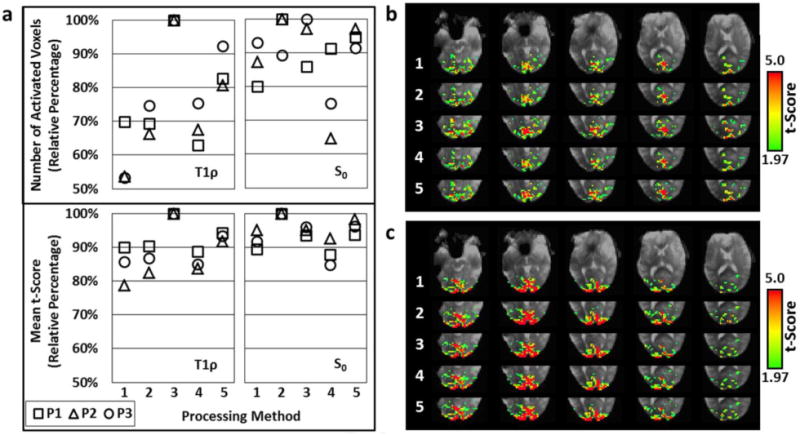
Fig. 8.

Comparison of the five processing methods shown in Fig. 2 for the in vivo functional T1ρ mapping studies. Both the T1ρ and S0 time series were assessed. (a) Plots of the relative number of positively-activated voxels (p<0.05) and mean t-scores in the visual cortex using each method. Data is shown for each participant (P1 (squares), P2 (triangles), and P3 (circles)). (b) T1ρ and (c) S0 activation maps for Participant 1 (P1) generated using each method with five slices shown. For processing of the T1ρ time series, Method 3 (temporal interpolation of the 50 ms TSL images) provided the greatest activation. For the S0 time series, Method 2 was the best (temporal interpolation of the 10 ms TSL images).
