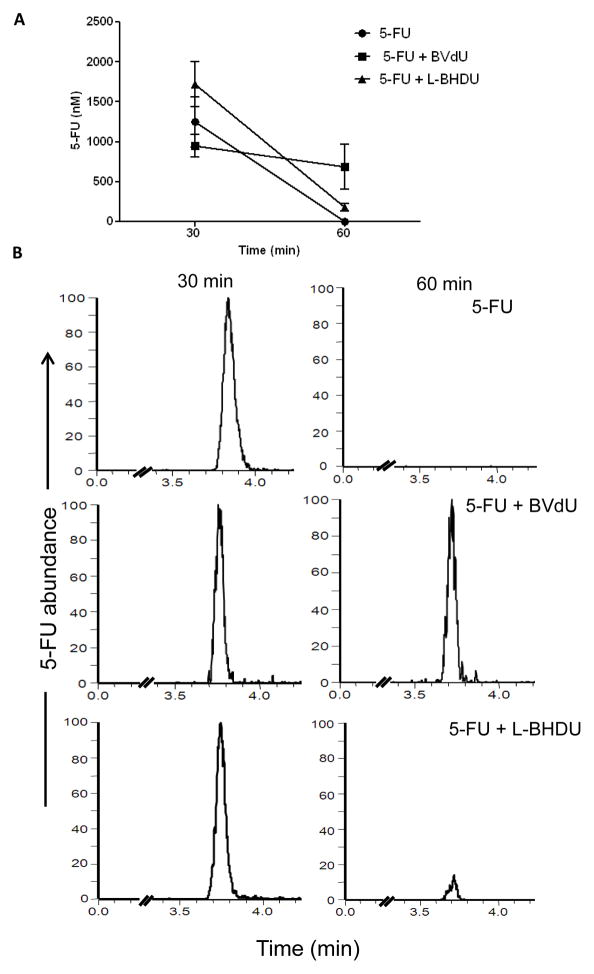
Figure 4. Effect of L-BHDU on 5-FU metabolism in vivo.
(A) The absolute concentration of 5-FU in plasma was measured by LC-MS/MS. Each point represents the average and standard deviation of 3 mice. (B) Representative MS chromatograms of individual mice show that BVdU interfered with 5-FU catabolism while L-BHDU did not. For each drug study, the intensity of each 5-FU assay run was normalized to the same signal intensity for the 30 and 60 min time points.

