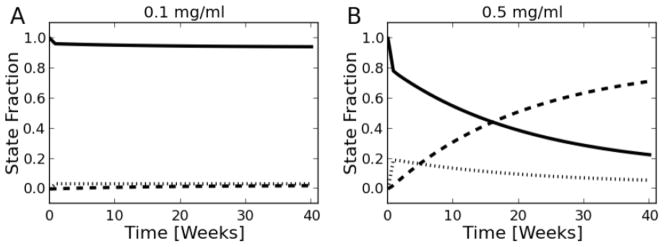
Figure 8. Liver unit state predictions based on the model.

Fraction of liver units in each state for the 0.1 (A) and 0.5 (B) mg/ml experimental doses. This reflects the overall health of the liver rather than specific changes in IL-6 production. Solid lines represent the H state, while vertical and dashed lines correspond to the C and I states, respectively.
