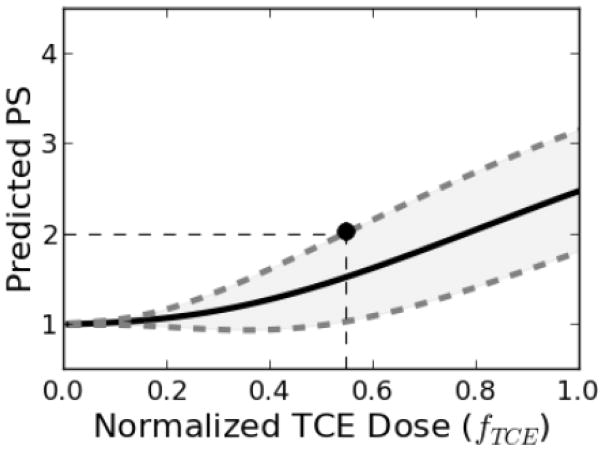
Figure 9. Dose response curve for current study.
Predicted dose response curves for pathology scores (PS) 40 weeks post TCE exposure. The mean values and 95% confidence intervals are shown as solid and dashed lines, respectively. The point represents the value of the benchmark dose (BMD) corresponding to the benchmark response level (BMR) described in the text.

