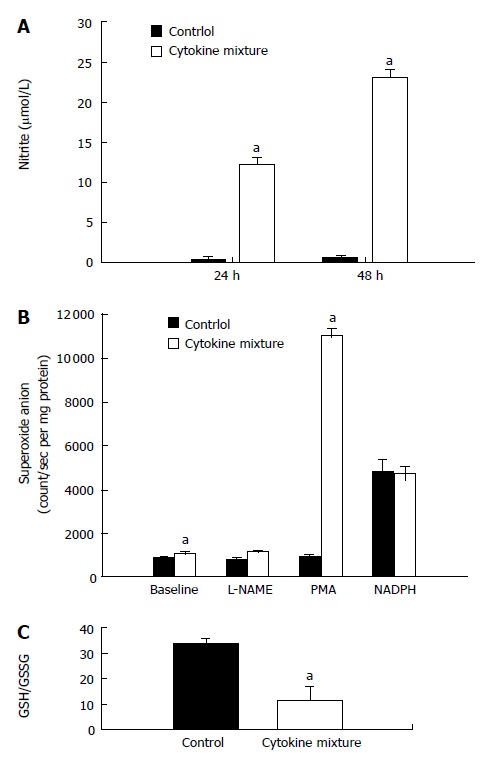
Figure 2.

Oxidant status of KKU-100 cells after exposure to a mixture of inflammatory cytokines. A: Stimulation of nitric oxide production, assayed as nitrite levels. Cultured media was collected at 24 and 48 h after exposure; B: Superoxide formation. Cell cultures were washed and incubated with PMA (0.68 μg/mL), L-NAME (100 μmol/L), or NADPH (200 μmol/L), and superoxide production was measured using the chemiluminescence method; C: Redox status was assessed as the GSH and GSSG ratio. Results are presented as mean ± SE from 3 separate experiments. aP < 0.05 between cytokine treated and the respective control groups.
