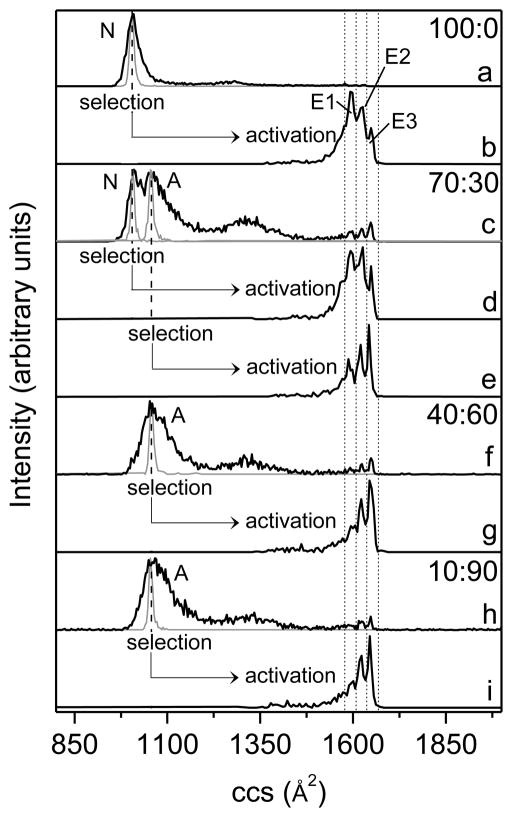
Figure 3.
Collision cross section (ccs) profiles for ubiquitin [M+7H]7+ ions obtained at different experimental conditions. (a), (c), (f), and (h) show the initial distributions of ions formed by electrospraying different water:methanol solutions (black lines) and the distributions for mobility-selected ions that are isolated at G2 (grey lines). Solution compositions (water:methanol) are provided as labels. Distributions (b) and (d) are obtained by collisionally activating (100 V, at IA2) the selected ions having cross sections around 1010 Å2, and distributions (e), (g), and (i) correspond to the activated ions with initial cross sections around 1060 Å2. The activated distributions are plotted underneath the corresponding selected distributions indicated by arrow-headed lines. Short dashed lines designate the integration regions for determining populations of elongated states E1-E3. The solution states of ubiquitin (N and A) from which ions are generated and the elongated states (E1-E3) obtained upon collisional heating have been labeled.

