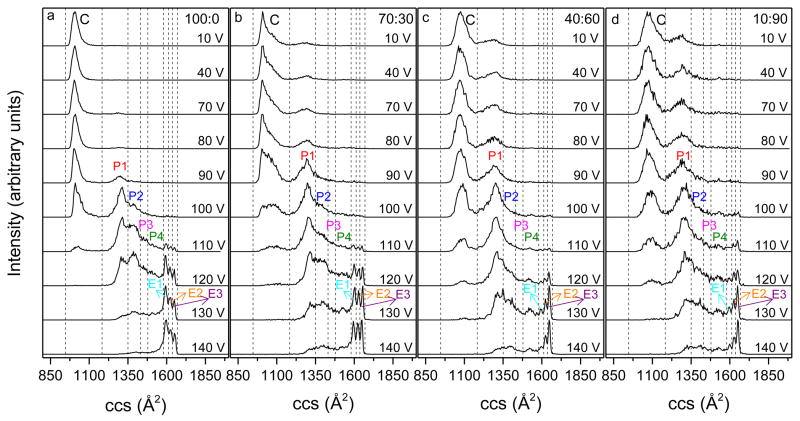
Figure 5.
Collision cross section (ccs) distributions for ubiquitin [M+7H]7+ ions that are activated at IA1 with voltages from 10 to 140 V. Panels a-d show profiles for ions that are generated from 100:0, 70:30, 40:60 and 10:90 water:methanol solutions, respectively. Dashed lines are drawn to designate the integration regions for determining populations of different conformers that are compact (C), partially folded (P1-P4) and elongated (E1-E3). Different conformers have been labeled.

