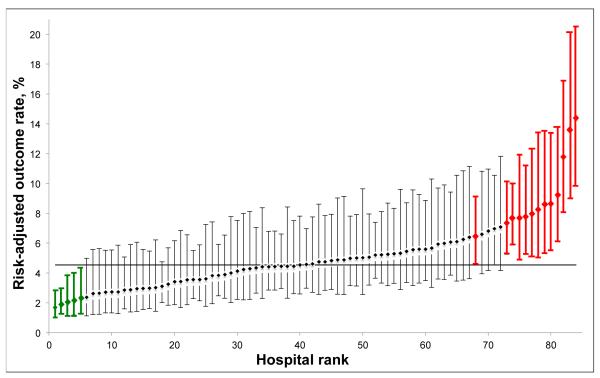
Figure 1.
Example performance report (any complication, hospitals with at least 125 cases/yr, laparoscopic gastric bypass procedures). Diamonds: hospital risk adjusted outcome rates with 95% confidence intervals. Green: low outliers, have 95% confidence intervals less than the average outcomes rate. Red: high outliers, have 95% confidence intervals greater than the average outcomes rate. Solid horizontal line, overall average outcomes rate.

