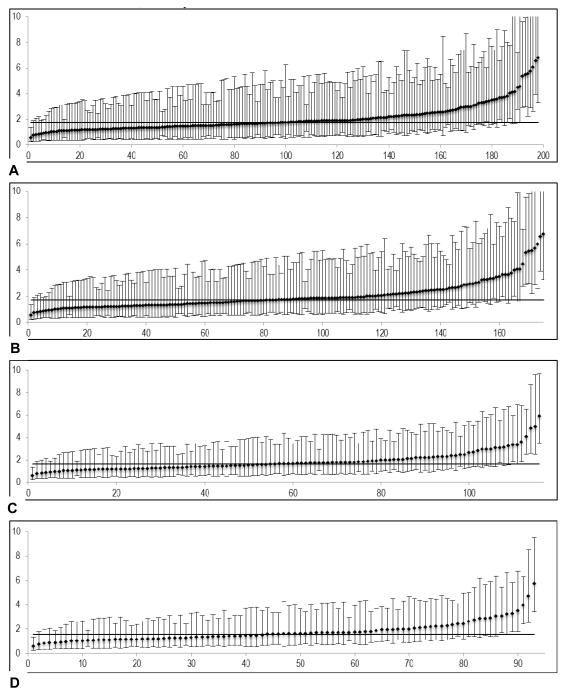
Figure 3.
Risk-and reliability adjusted outcome rates (serious complications) at different caseload thresholds for reporting. Y-axis: percent events (%), X-axis: hospital rank. (A) No caseload threshold; reliability 0.475. (B) Reporting threshold 50 cases/y; reliability 0.508. (C) Reporting threshold 100 cases/y; reliability 0.527. (D) Reporting threshold 125 cases/y; reliability 0.534.

