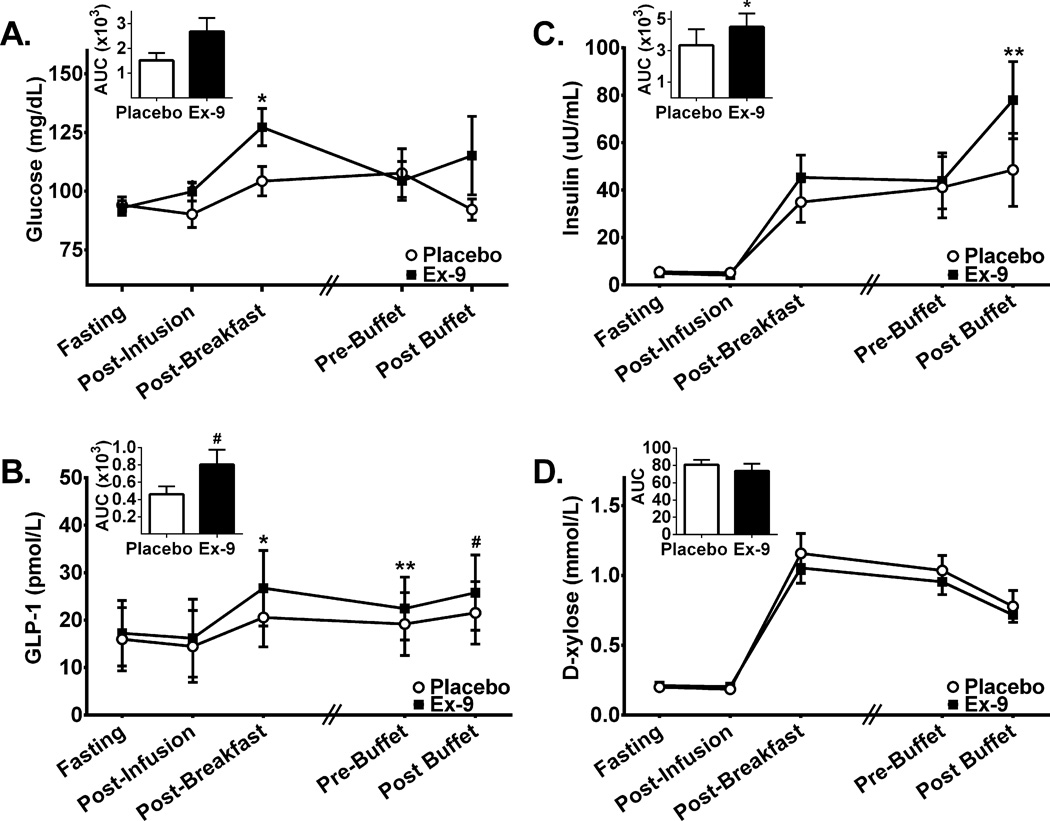
Figure 2. Plasma glucose, insulin, GLP-1, and D-xylose concentrations during Ex-9 and placebo infusion.
Inset bar graphs represent incremental area under the curve (AUC) for the corresponding hormone throughout the protocol period. There was a main effect of Ex-9 for plasma glucose (A; F1,7=8.84; P=0.02) and GLP-1 (B; F1,6=17.94; P<0.01), and a trend was present for insulin as well (C; F1,7=5.10; P=0.06). Compared to placebo, Ex-9 treatment increased AUC values in insulin and GLP-1. Time point specific analyses revealed that Ex-9 infusion as compared to placebo resulted in elevations in levels of: A) glucose after infusion initiation and after breakfast, C) insulin after the buffet meal and B) GLP-1 after the breakfast meal and prior to the buffet. D-xylose concentrations were not significantly different between treatments (D; F1,7=4.35; P=0.08). All time points are 30 minutes apart except for between Post-Breakfast and Pre-Buffet (indicated by hash marks) where actual time elapsed was ~60–90 min. and was matched within subjects. A, C &D: N=8 for all points except for Post-Infusion where N=6. B: N=7 for all time points except for Post-Infusion where N=5. Ex-9, Exendin-[9–39], GLP-1, glucagon-like peptide-1, #P=0.06, *P<0.05, **P<0.01.

