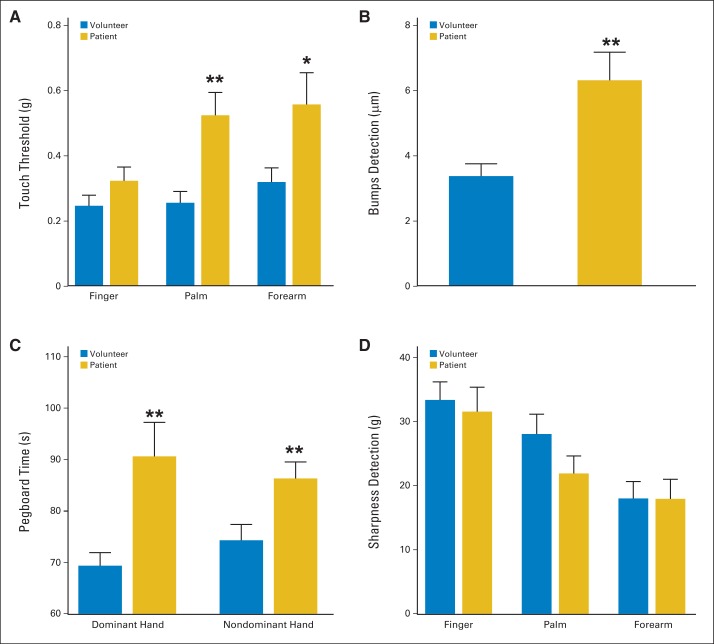
Fig 1.
Touch detection, bumps detection, pegboard performance, and sharpness detection. Bar graphs show means (and SEs; horizontal bars) for measures of large myelinated fiber or Aδ function in patients with multiple myeloma (gold) versus healthy volunteers (blue). Results of (A) touch detection determined using von Frey monofilaments, (B) bumps detection threshold performed using index finger of dominant hand, (C) dominant and nondominant hands in completing slotted pegboard task, and (D) sharpness detection threshold. (*) P < .05; (**) P < .01.

