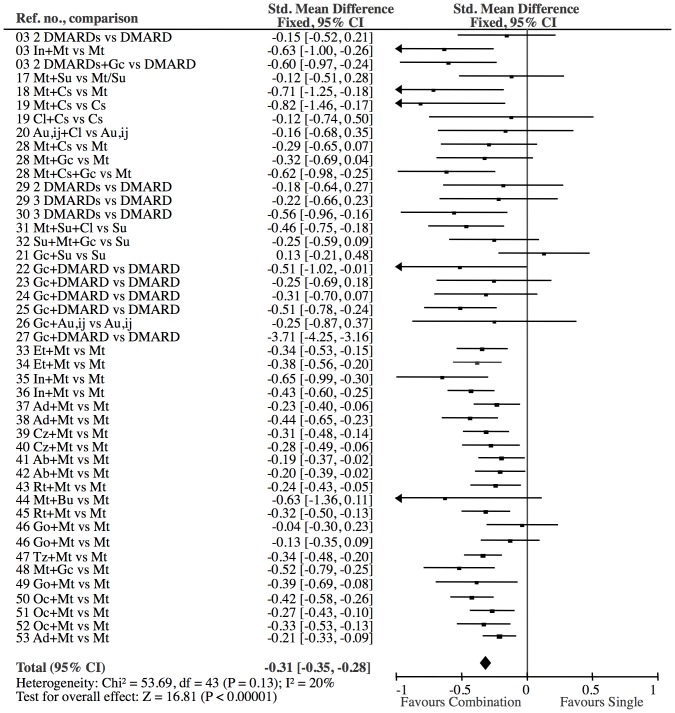
Figure 2. Combination treatment versus single DMARD.
The effect on all studies is −0.33 SMD (CI: −0.36, −0.29). Test for overall effect: Z = 17.66 (P<0.00001). Heterogeneity: Chi2 = 201.54, df = 44 (P<0.00001); I2 = 78%. One study [27] contributed to heterogeneity due an extreme effect (−3.71 SMD). The elimination of this study resulted in a little more conservative estimate (−0.31 SMD (CI:−0.35, −0.28), Z = 16.81), but eliminated the significant heterogeneity (I2 = 20, p = 0.13). Consequently, reference [27] was excluded from all comparisons. N, combination: 6725; N, single: 5446.

