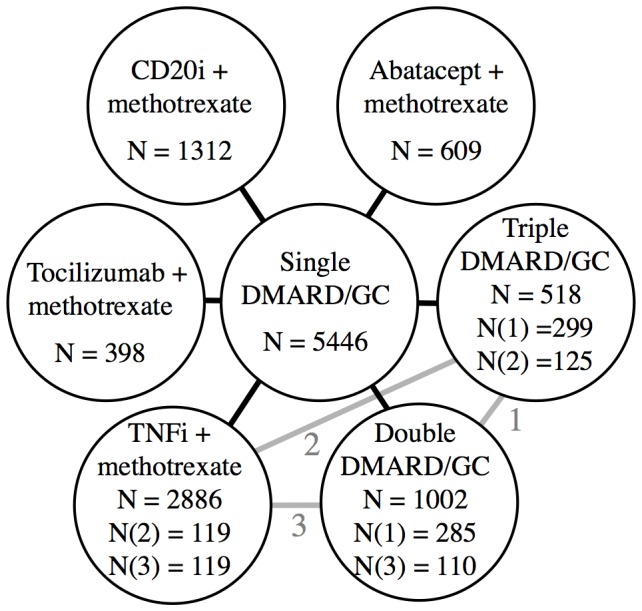
Figure 3. Star shaped network showing the 6 different combination treatments anchored on single treatment as the common comparator.

The loops (grey lines) with corresponding numbers (1, 2, 3) show the subgroups, which were directly compared in addition to being indirectly compared. N indicates the number of patients in the groups.
